Show EOL distros:
Package Summary
This package provides visualization logic for ism data, e.g. visualization with marker in rviz.
- Maintainer: Meißner Pascal <asr-ros AT lists.kit DOT edu>
- Author: Hanselmann Fabian, Heller Florian, Heizmann Heinrich, Kübler Marcel, Meißner Pascal, Reckling Reno, Stöckle Patrick, Trautmann Jeremias
- License: BSD
- Source: git https://github.com/asr-ros/asr_ism_visualizations.git (branch: master)

Contents
Description
This package provides visualization logic for ISM data, e.g. visualization with markers in RVIZ.

Functionality
The asr_ism_visualizations package contains several classes for visualization of the ISM-datastructures. There are visualizations for the ISM itself, the pose prediction, the voting space, as well as for the reconstruction of the scene and basic visualizations of objects and object-overlays in RVIZ. It doesn't contain any nodes and its more like a library.
The separated visualization components are described now:
Recognition Result Visualization
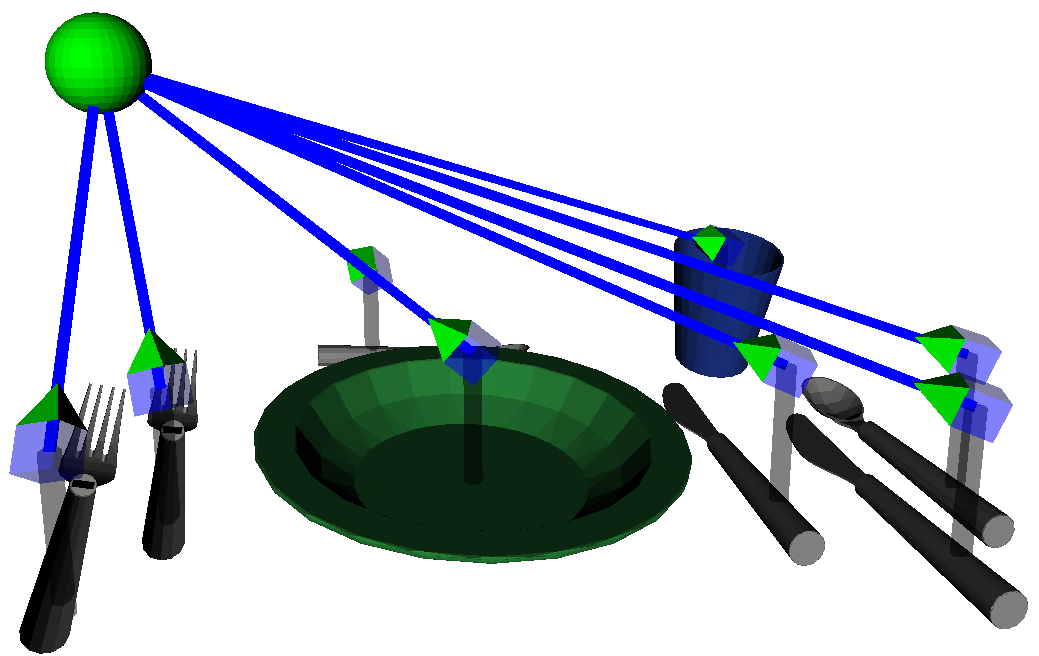
The recognition result visualization generates markers for the visualization of the scene-recognition result and visualizes an ISM tree. Due to the different structures of the recognition results (e. g. caused by different training methods), different visualization components are needed.
An object is represented by a cube with a pyramid and optionally a miniature-version of the object itself. The cube is colored in the color of the ISM and the pyramid is colored in a range from green to red displaying how good the current object pose matches in the object constellation. In addition the Pyramid points to the ISM, the object is part of.

An ISM is visualized by a sphere and a cone. The colors of them are chosen similar to the pyramids and represents the confidence of the ISM. The cone points to its parent-ISM. If the ISM is the root-ISM, the size of the sphere is doubled and it has no cone (cause there is no parent to point to). Object- and ISM-Markers are connected through lines colored in the color of the ISM.

There are several parameters to configure the recognition result visualization:
- markerLifetime: how long a marker is shown (0 = infinity)
- baseFrame: the frame, the markers pose is relative to
- lineScale: the width of the lines
- treeDepthSize: the height of every ISM-Layer
- isPoseRelative: when true, align ism to frame of ISM-Root and not to baseframe
- ignoreZOffset: when true, the height of all objects (in visualization) is on one plane and are ignored by visualization
- useSceneColoring: when true, color ISM homogeneously. (One color per scene and not per ISM) This is useful if you want to display more than one ISM in a single visualization.
- useZOffsetMax: use maximum of offset-calculation (otherwise minimum) e. g. when ISM is orientated downside
Pose Prediction Visualization
The poseprediction visualization can be used for visualization of missing objects or for the reconstruction of a scene.
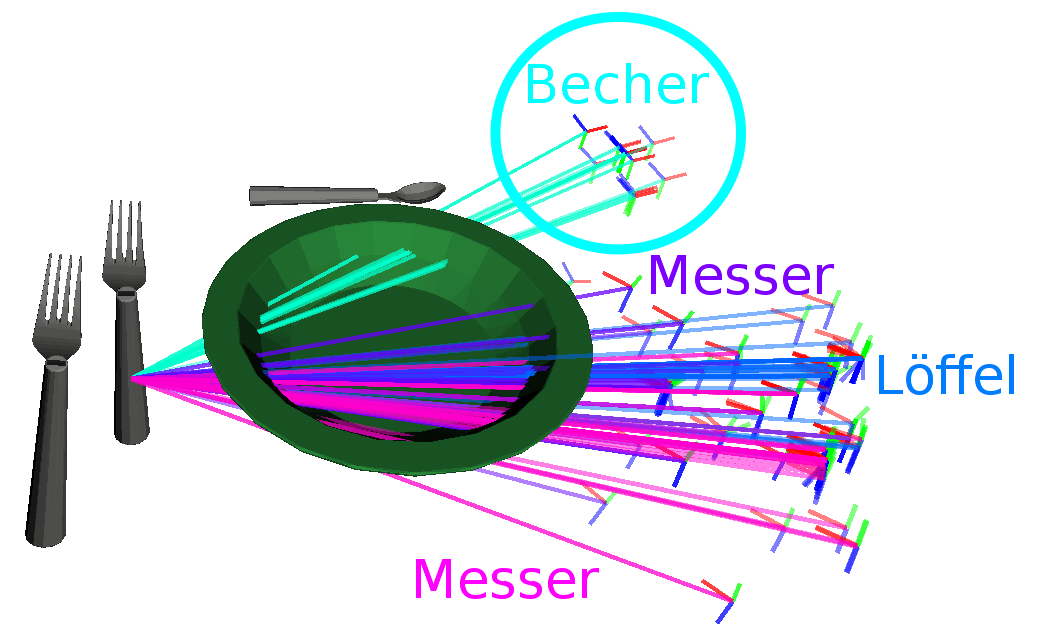
Due to many possible object poses for each missing object, the pose prediction returns an attributed point cloud with some reasonable object poses. Each pose is visualized with an oriented arrow, which encodes position and orientation with a frame on its ending. All poses belonging to one object are colored with the same hue value. The prediction always starts form the reference of an ISM.

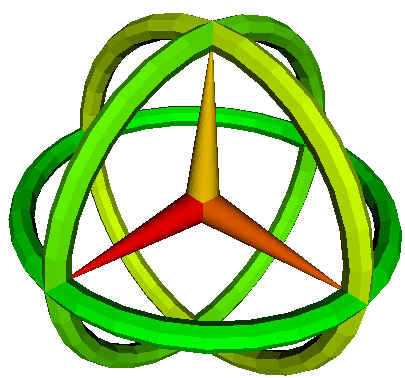
Additionally, the user can choose a concrete object and a predicted pose e. g. for placing the real object like the predicted pose. Therefore, the object has to be detected via object recognition with a camera. After choosing the desired pose a marker is drawn which shows the difference and deviation in all 6 dimensions. The color is ranged from red to green and encodes the derivation relatively, with green being very close to the predicted pose.
There are also some parameters to set via dynamic reconfigure:
- markerLifetime: how long a marker is shown (0 = infinity)
- baseFrame: the frame, the markers pose is relative to
- lineScale: width of the lines
- axisScale: width of the coordinate frames
- maxDistanceInOverlay: maximum derivation in position for scene reconstruction
- maxAngleInOverlay: maximum derivation in orientation for scene reconstruction
Valid Pose Visualization
The valid pose visualization is pretty similar to the pose prediction visualization. This visualization can be used to show randomly generated poses which are valid for an object. In addition a sphere is drawn to visualize the whole area in which an object has to be to be recognized as part of the current scene.
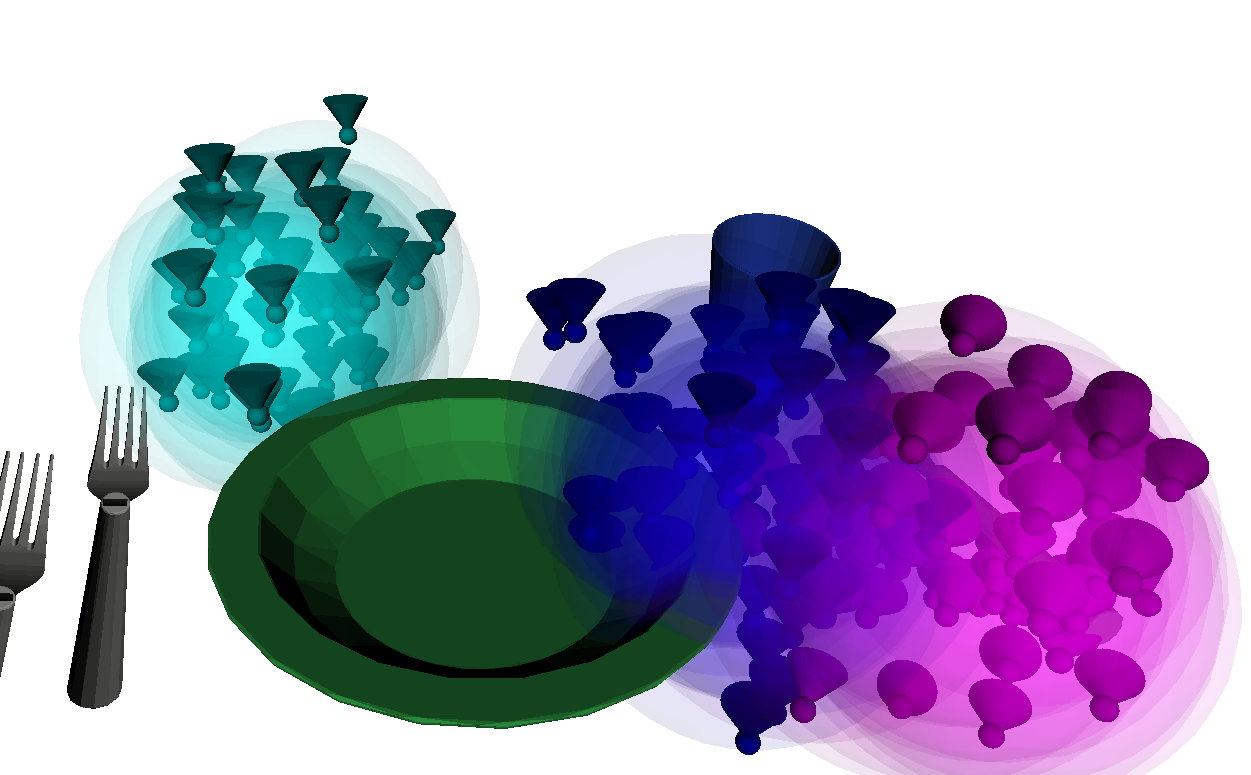
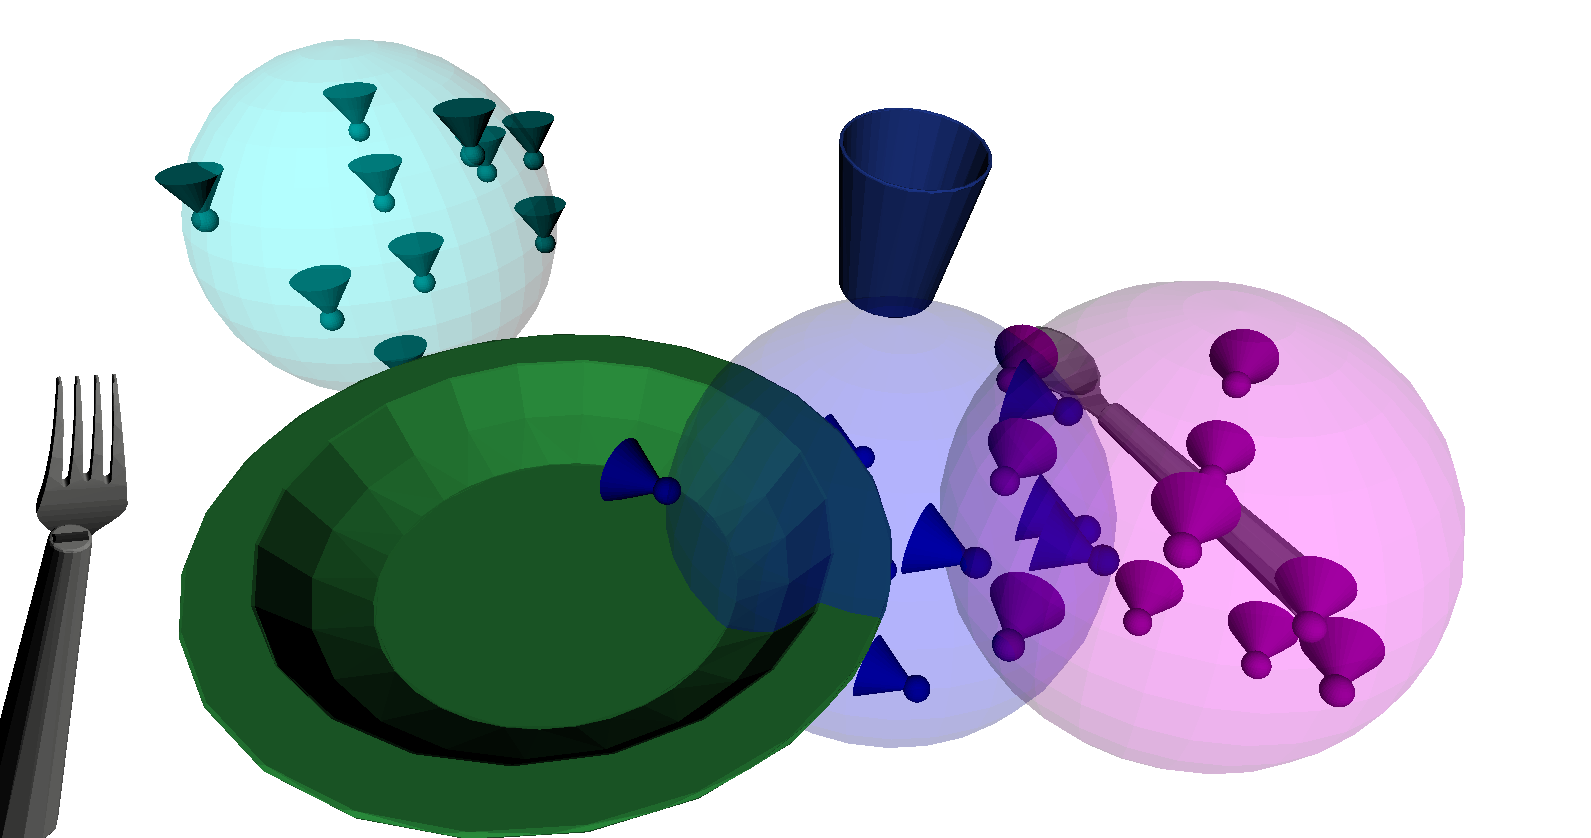
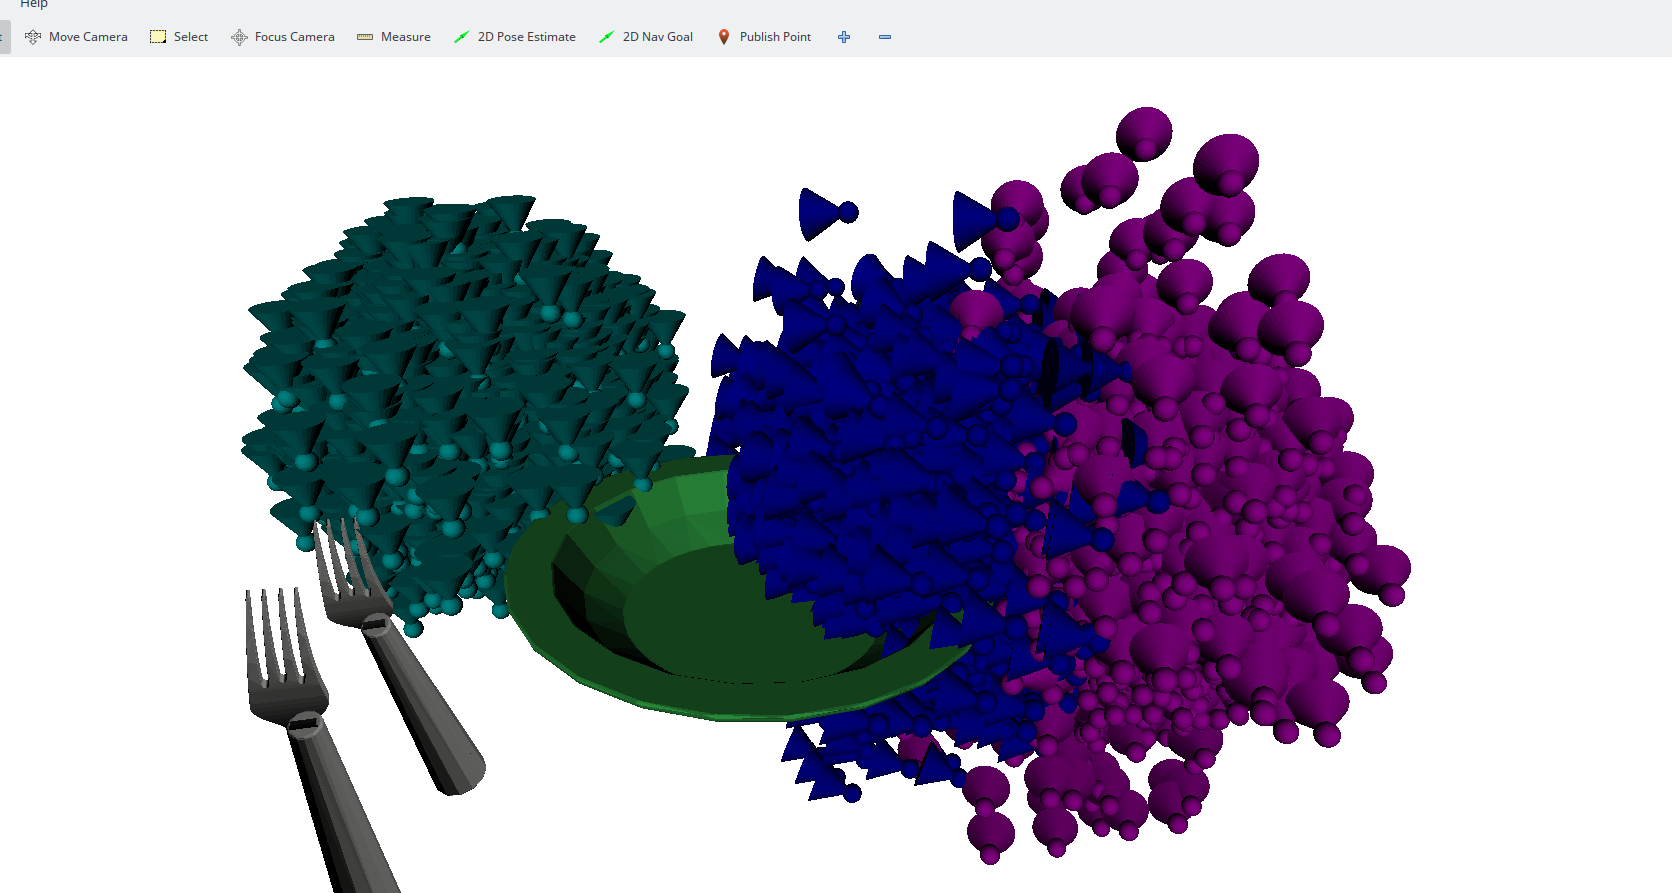
The markers are small spheres to show the position with cones visualizing the allowed derivation in orientation exemplarily for an axis (by default X-Axis of an object).
The following parameters can be used in dynamic reconfigure:
- objectAxisMap: maps objects to visualized axes (e.g. "Object1-X;Object2-Y")
- objectSamples: sample factor for pose prediction
- posePredicitonAlpha: alpha value of sphere marker
- posePredictionValue: color value (HSV-color model) of sphere marker
- sampleAlpha: alpha value of object samples
- sampeValue: color value (HSV-color model) of object samples
- sampleScale: scaling of object samples
Voting space Visualization
- The voting space contains information about the votes and the trained model of an ISM. The visualization of it consists mainly of two components:
The votes of an object are drawn as an "oriented arrow", which is basically a line with a coordinate frame. So position and orientation of the votes can be visualized as well as the object they belong to (the voter).

Each object has several votes which results in the votingspace. This space is subdivided in voxels, the so called bins. All votes to a bin are counted and visualized as a cube drawn in the center of all non-empty bins. The color shows the amount of votes relatively to the maximum number of votes in one bin. (green: maximum, red = 1, not drawn = 0)
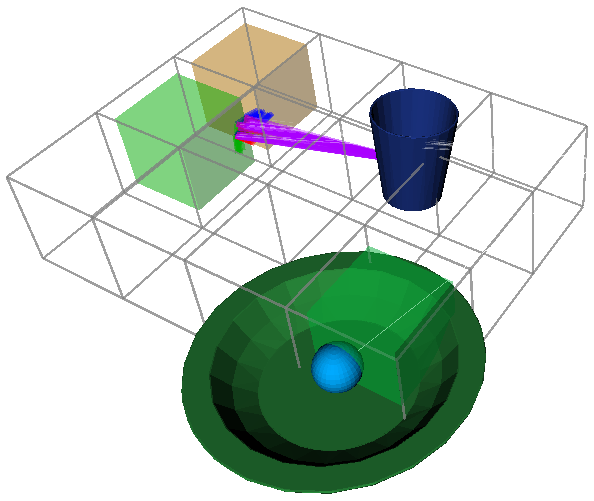
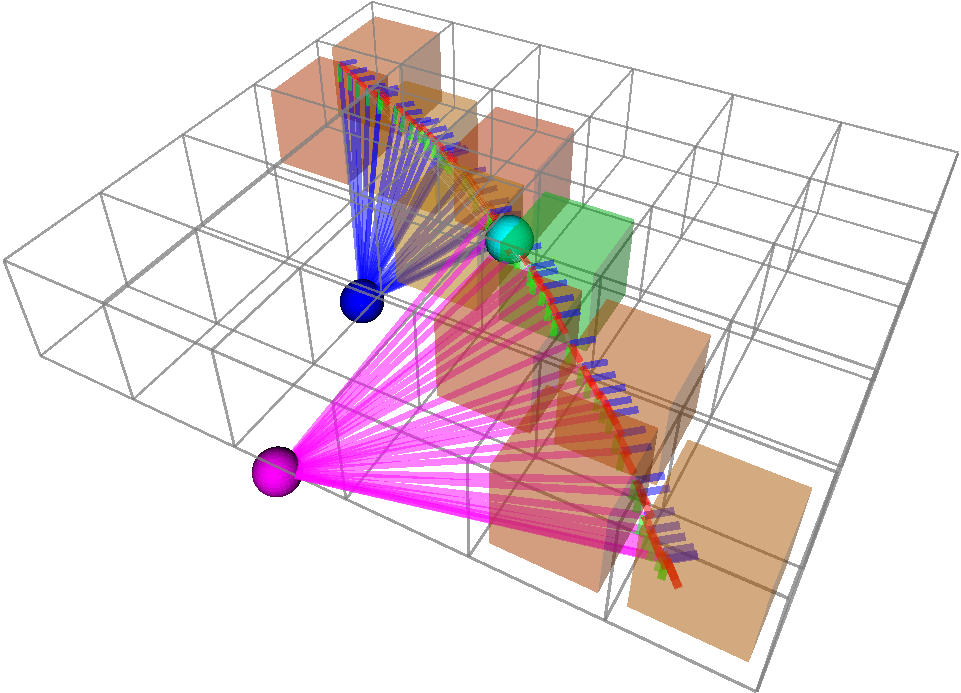
There are several parameters to set via dynamic reconfigure:
- markerLifetime: how long a marker is shown (0 = infinity)
- baseFrame: the frame, the markers pose is relative to
- lineScale: width of the lines
- axisScale: width of the coordinate frames
- binScale: percentage of voxel filling
- gridScale: width of gridlines
- objectMarkerScale: scale of spheres, representing objects
- binOpacity: opacity of voxel filling
- gridOpacity: opacity of gridlines
- objectMarkerOpacity: opacity of spheres, representing objects
- confidenceSphereOpacity: opacity of sphere, representing the sphere around the reference object with diameter of bin_size
- patternName: name of pattern, votingspace shoud be drawn
- sceneName: name of scene, pattern belongs to
Usage
Normally this package is used by another package like asr_ism and provides no independent components.
Needed packages
asr_msgs: Messages e. g. AttributedPointCloude
asr_lib_ism: ISM data-structues e. g. RecognitionResult
Needed software
ROS Nodes
Subscribed Topics
Only topics of dynamic reconfigure are being subscribed to. (e. g. /recognizer/pose_prediction_visualizer/parameter_updates)
Published Topics
All generated markers of ISM-result-visualization, pose-prediction-visualization and voting-space-visualization are published (by default) on /ism_results_visualization (msg-Type: Markerarray)
