Show EOL distros:
Package Summary
rqt_bag_plugins contains visualization plugins for the rqt_bag ROSGUI plugin.
rqt_bag is a graphical framework for analyzing bag (log) files. rqt_bag_plugins provide visualizers for messages of different types.
- Author: Aaron Blasdel
- License: BSD
- Source: git https://github.com/ros-visualization/rqt.git (branch: fuerte-devel)
Package Summary
rqt_bag provides a GUI plugin for displaying and replaying ROS bag files.
- Maintainer status: developed
- Maintainer: Aaron Blasdel <ablasdel AT gmail DOT com>, Austin Hendrix <namniart AT gmail DOT com>
- Author: Aaron Blasdel, Tim Field
- License: BSD
- Bug / feature tracker: https://github.com/ros-visualization/rqt_common_plugins/issues
- Source: git https://github.com/ros-visualization/rqt_common_plugins.git (branch: groovy-devel)
Package Summary
rqt_bag provides a GUI plugin for displaying and replaying ROS bag files.
- Maintainer status: developed
- Maintainer: Aaron Blasdel <ablasdel AT gmail DOT com>, Austin Hendrix <namniart AT gmail DOT com>
- Author: Aaron Blasdel, Tim Field
- License: BSD
- Bug / feature tracker: https://github.com/ros-visualization/rqt_common_plugins/issues
- Source: git https://github.com/ros-visualization/rqt_common_plugins.git (branch: master)
Package Summary
rqt_bag provides a GUI plugin for displaying and replaying ROS bag files.
- Maintainer status: maintained
- Maintainer: Dirk Thomas <dthomas AT osrfoundation DOT org>, Aaron Blasdel <ablasdel AT gmail DOT com>, Austin Hendrix <namniart AT gmail DOT com>
- Author: Aaron Blasdel, Tim Field
- License: BSD
- Bug / feature tracker: https://github.com/ros-visualization/rqt_bag/issues
- Source: git https://github.com/ros-visualization/rqt_bag.git (branch: master)
Package Summary
rqt_bag provides a GUI plugin for displaying and replaying ROS bag files.
- Maintainer status: maintained
- Maintainer: Mabel Zhang <mabel AT openrobotics DOT org>, Michael Jeronimo <michael.jeronimo AT openrobotics DOT org>
- Author: Dirk Thomas <dthomas AT osrfoundation DOT org>, Aaron Blasdel <ablasdel AT gmail DOT com>, Austin Hendrix <namniart AT gmail DOT com>, Tim Field
- License: BSD
- Bug / feature tracker: https://github.com/ros-visualization/rqt_bag/issues
- Source: git https://github.com/ros-visualization/rqt_bag.git (branch: master)
Package Summary
rqt_bag provides a GUI plugin for displaying and replaying ROS bag files.
- Maintainer status: maintained
- Maintainer: Mabel Zhang <mabel AT openrobotics DOT org>, Michael Jeronimo <michael.jeronimo AT openrobotics DOT org>
- Author: Dirk Thomas <dthomas AT osrfoundation DOT org>, Aaron Blasdel <ablasdel AT gmail DOT com>, Austin Hendrix <namniart AT gmail DOT com>, Tim Field
- License: BSD
- Bug / feature tracker: https://github.com/ros-visualization/rqt_bag/issues
- Source: git https://github.com/ros-visualization/rqt_bag.git (branch: noetic-devel)
Usage
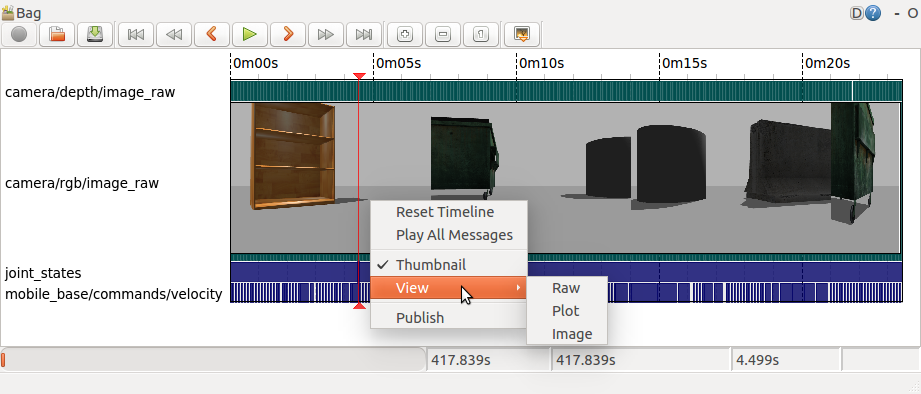
To access these plugins, launch the rqt_bag GUI tool (see rqt_bag for details), right-click on the timeline of the desired topic select a view type from the context menu.

Plugins
The following plugins are currently provided for rqt_bag:
Image
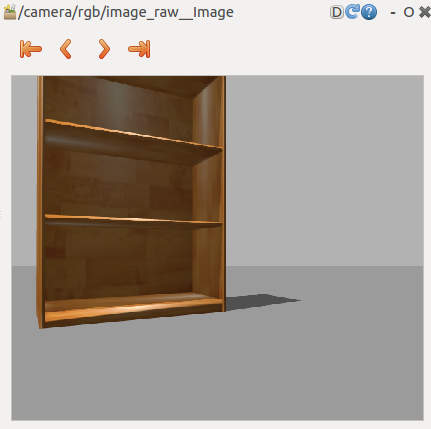
The image view displays raw image data for sensor_msgs/Image and sensor_msgs/CompressedImage messages:

Re-sizing the window scales the image.
Plot
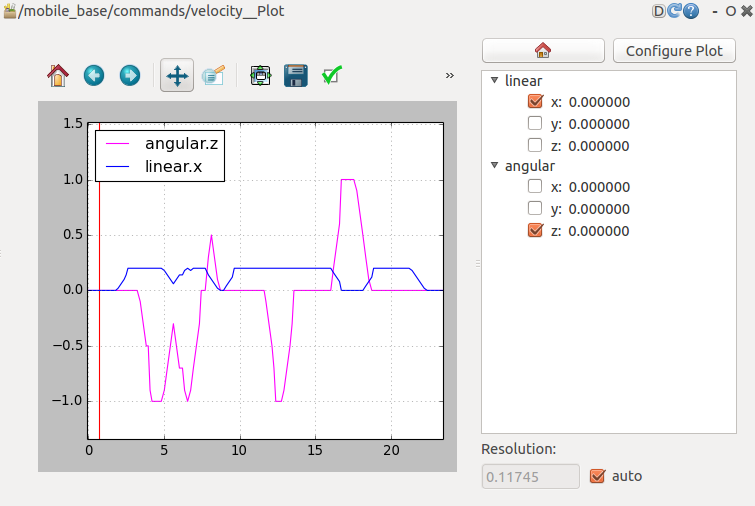
The plot view displays a time series plot of numeric fields in a ROS message. The view inherits from the rqt_plot code base, so all plotting options are the same as with rqt_plot.

To plot a message field, select the field from the list in the right window (Note: currently only fields from the same message topic can be plotted in the same view window).
Clicking on the Configure Plot button in the toolbar opens a new window for selecting the plotting backend and marker preferences.
By default, the plotted data is sub-sampled in time to minimize the cpu load. To change the sampling resolution, deselect 'auto' in the Resolution section and enter a sampling time in seconds. The plotted data will automatically refresh with the new sampling time.
